



Navigating the maritime fuel transition: How fuel economics, regulations, and fleet decisions shape the future bunkering landscape
Completed
Project overview
Timeline
September 2026
GCMD team members
Dr Bhushan TASKAR
Lead
Rex LEE
Wee Meng TAN
Partners
Boston Consulting Group (BCG)

Link copied to clipboard
Table of contents
- Background of the study
- Hear from the team
- Overview and scope of this model
- Under which conditions do new fuels become economically competitive with conventional fuels?
- Which factors strongly influence the adoption of different fuel pathways?
- How do fuel economics influence engine ordering decisions and the long-term evolution of the fleet?
- How might these developments reshape the future global bunkering landscape?
- What should maritime stakeholders do now?
Background of the study
Two uncertainties are shaping the maritime fuel transition
The regulatory landscape continues to evolve. The International Maritime Organization (IMO)’s Net-Zero Framework (NZF) has yet to be adopted, with the next decision point at the 85th session of the Marine Environment Protection Committee (MEPC 85) in December 2026, while regional schemes such as the European Union Emissions Trading System (EU ETS) and FuelEU Maritime Regulation are already in force or advancing.
Whatever form the regulatory landscape ultimately takes, whether the NZF as proposed, a revised version, or an alternative mechanism, the key question remains the same: will it produce a carbon price signal strong enough to close the cost gap?
At the same time, fuel cost gaps between conventional and new fuels remain wide. How quickly, or whether, these gaps close will vary across fuel pathways and regions.
Shipowners must make long-term decisions before the economics are clear
With vessels lasting 25-30 years and only around 4% of the fleet renewed each year, many vessels ordered over the coming decade will still be operating in 2050.
Shipowners are therefore making long-lived engine choices before the relative economics of future fuels are clear.
Modelling how policy and fuel economics could shape shipping’s transition
To help stakeholders navigate these uncertainties, the Global Centre for Maritime Decarbonisation (GCMD) and Boston Consulting Group (BCG) have jointly developed an integrated model that examines these four questions:
1. Under which conditions do new fuels become economically competitive with conventional fuels?
2. Which factors strongly influence the adoption of different fuel pathways?
3. How do fuel economics influence engine ordering decisions and the long-term evolution of the fleet?
4. How might these developments reshape the future global bunkering landscape?
Hear from the team
This study uncovers an interesting dynamic between fuel-price evolution, engine uptake and actual fuel use. It shows that timing matters: near-term economics shape the orderbook, and the orderbook shapes which fuels can ultimately scale. The value of the work lies in identifying the key sensitivities and market signposts that shipowners, operators, fuel producers, and ports should watch as the transition unfolds.
Dr Bhushan TASKAR, Project Director, GCMD
The maritime fuel transition is being shaped as much by policy and cost uncertainty as by technology readiness. Rather than offer a single prediction, our approach with GCMD maps how sensitive each fuel pathway’s competitive position is to a handful of critical variables—policy scenarios, key cost drivers, and potential restrictions. Our hope is that this gives shipowners, fuel suppliers, port operators, and infrastructure investors a practical tool to stress-test their own fuel strategies as conditions change.
Anand VEERARAGHAVAN, Managing Director & Senior Partner, BCG
Overview and scope of this model
The integrated model examines how policy and fuel-cost assumptions influence newbuild engine choices, fleet evolution and fuel consumption through 2050, and how these outcomes could shape the future global bunkering landscape.
It captures the interaction between fuel economics and engine adoption over time: the relative economics of different fuels influence which engines are ordered, while the resulting fleet composition determines which fuels vessels are capable of consuming in subsequent years.
The model assesses twelve fuel pathways across two broad categories:
- Conventional fuels include very low sulphur fuel oil (VLSFO) and fossil liquefied natural gas (LNG)
- New fuels comprise first- and second-generation biodiesel, hydrotreated vegetable oil (HVO), bio-LNG, bio-methanol, and first- and second-generation bio-ethanol, blue ammonia, e-methanol, and e-ammonia
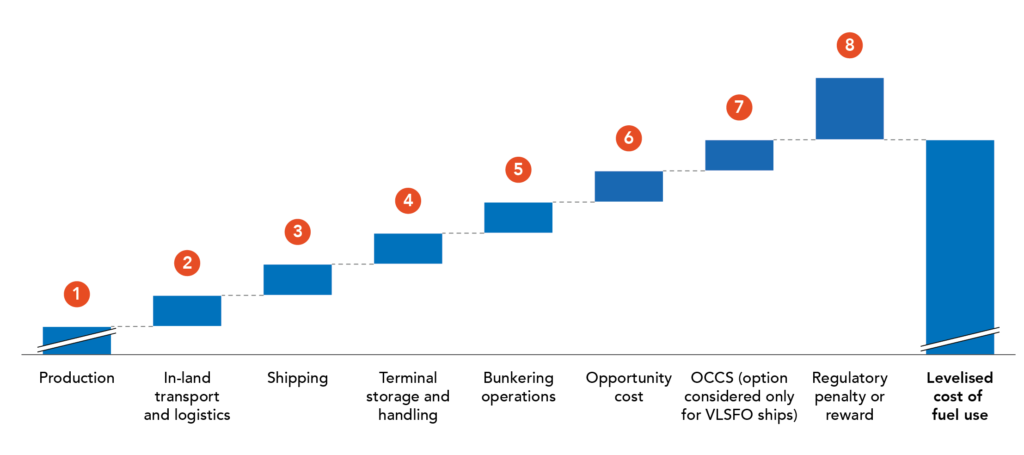
The levelised cost of fuel use is built up from seven cost components across the fuel’s full value chain, not just what it costs to produce.
- Production
- In-land transport and logistics
- Shipping
- Terminal storage and handling
- Bunkering operations
- Opportunity cost—refers to additional newbuild capital expenditure (CAPEX), additional non-fuel operating expenditure (OPEX), including crew training, maintenance and insurance, and lost cargo revenue arising from reduced cargo capacity.
- OCCS (onboard carbon capture and storage)—an optional cost, considered only for VLSFO ships
Regulatory penalties and incentives are assessed separately and combined with these costs when evaluating fuel competitiveness under each policy scenario.
The model covers six engine configurations:
- Conventional engines
- Conventional engines + OCCS
- LNG dual-fuel engines
- Methanol dual-fuel engines
- Ammonia dual-fuel engines
- Ethanol dual-fuel engines
Three policy scenarios were modelled:
1. Base scenario: assumes that the proposed IMO NZF, as agreed at MEPC 83, is adopted, with the Tier-2 remedial unit (RU) penalty held at USD 380/tCO2e through 2050. Zero or Near-Zero (ZNZ) rewards are assumed to lapse after 2044, when the Direct Compliance Target becomes more stringent than the ZNZ reward threshold. The base scenario serves as the reference point for the policy scenarios and fuel sensitivities that follow.
2. IMO high penalty scenario: assumes the proposed IMO NZF is adopted, with the Tier-2 RU penalty held at USD 380/tCO2e from 2028 to 2030 and rising linearly thereafter to USD 700/tCO2e by 2050. This scenario examines how a stronger global carbon pricing signal could affect fuel adoption.
3. EU regulations scenario: assumes no global framework in place, but considers EU ETS and FuelEU Maritime Regulation to be fully implemented through 2050. This scenario examines how the transition would evolve in the absence of a globally harmonised framework.
Under which conditions do new fuels become economically competitive with conventional fuels?
New fuels become cost-competitive with conventional fuels when the IMO Tier-2 RU penalty reaches USD 700/tCO₂e by 2050.
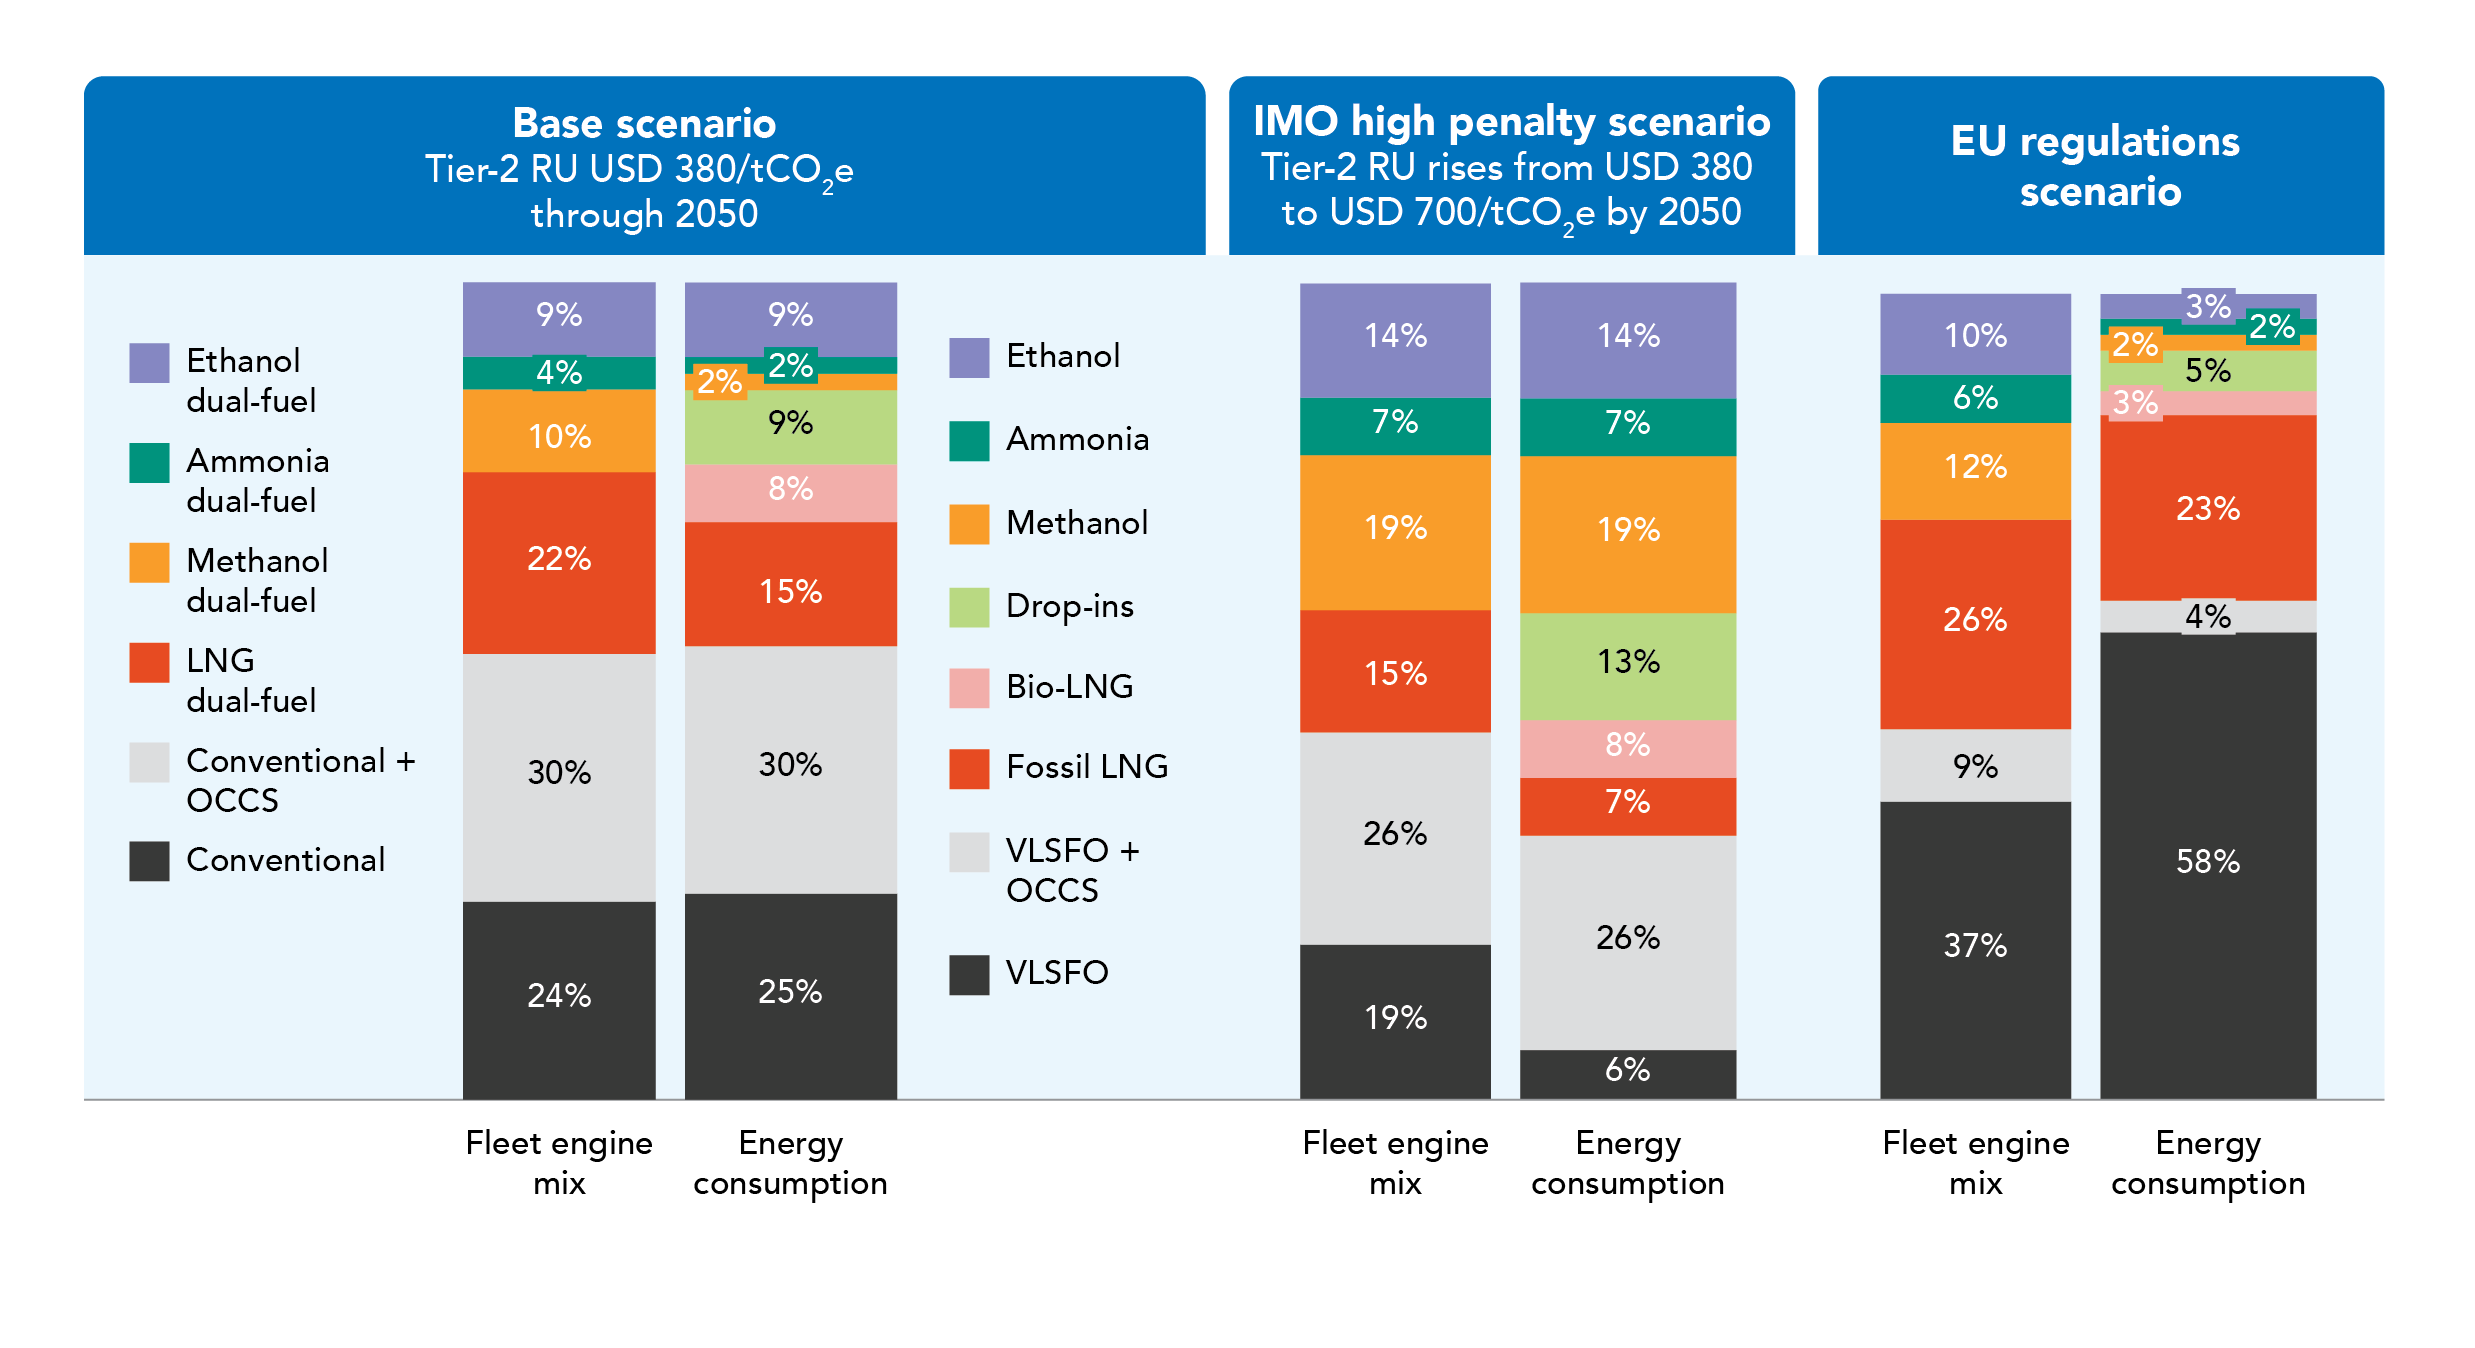
Under this high penalty scenario, new fuels—including drop-in fuels—supply approximately 61% of fleet energy consumption in 2050. VLSFO with OCCS contributes 26%, while VLSFO and fossil LNG account for around 13%.
By contrast, the model’s base scenario holds the Tier-2 RU penalty at USD 380/tCO₂e through 2050. Under these assumptions, conventional fuels remain more economical and new-fuel use stays well below installed dual-fuel capacity.
EU regulations alone do not drive a marked shift in the global fuel mix, as they apply to only around 20% of international shipping’s energy demand.
While a stronger global carbon price can accelerate the shift towards new fuels, the model does not point to a clear cost winner between e-methanol and e-ammonia.
Despite e-ammonia’s lower production cost than e-methanol, the two fuels yield similar levelised cost of fuel use in the base scenario.
This is because e-ammonia’s production cost advantage is offset by higher downstream costs. These include specialised storage requirements, higher engine CAPEX, and higher operational costs stemming from its toxicity, such as additional crew training, larger exclusion zones, and more complex bunkering operations. By contrast, e-methanol benefits from simpler handling and logistics across the supply chain.
Which factors strongly influence the adoption of different fuel pathways?
This model examines four key sensitivities, each providing a signpost for how fuel competitiveness and adoption could evolve.
- Two relate directly to feedstock inputs and, therefore, production costs: Levelised cost of hydrogen (LCOH), the primary cost driver for all e-fuels; and biogenic CO₂ cost, which influences the relative competitiveness of e-methanol versus e-ammonia.
- A third, the bio-methanol cost trajectory, governs the near-term affordability of the methanol pathway and could influence technology choices today and potential technology lock-in tomorrow.
- The fourth, the regulatory treatment of food-crop biofuels, acts as a binary switch for the ethanol pathway.
Four key uncertainties shaping fuel pathways’ competitivenes
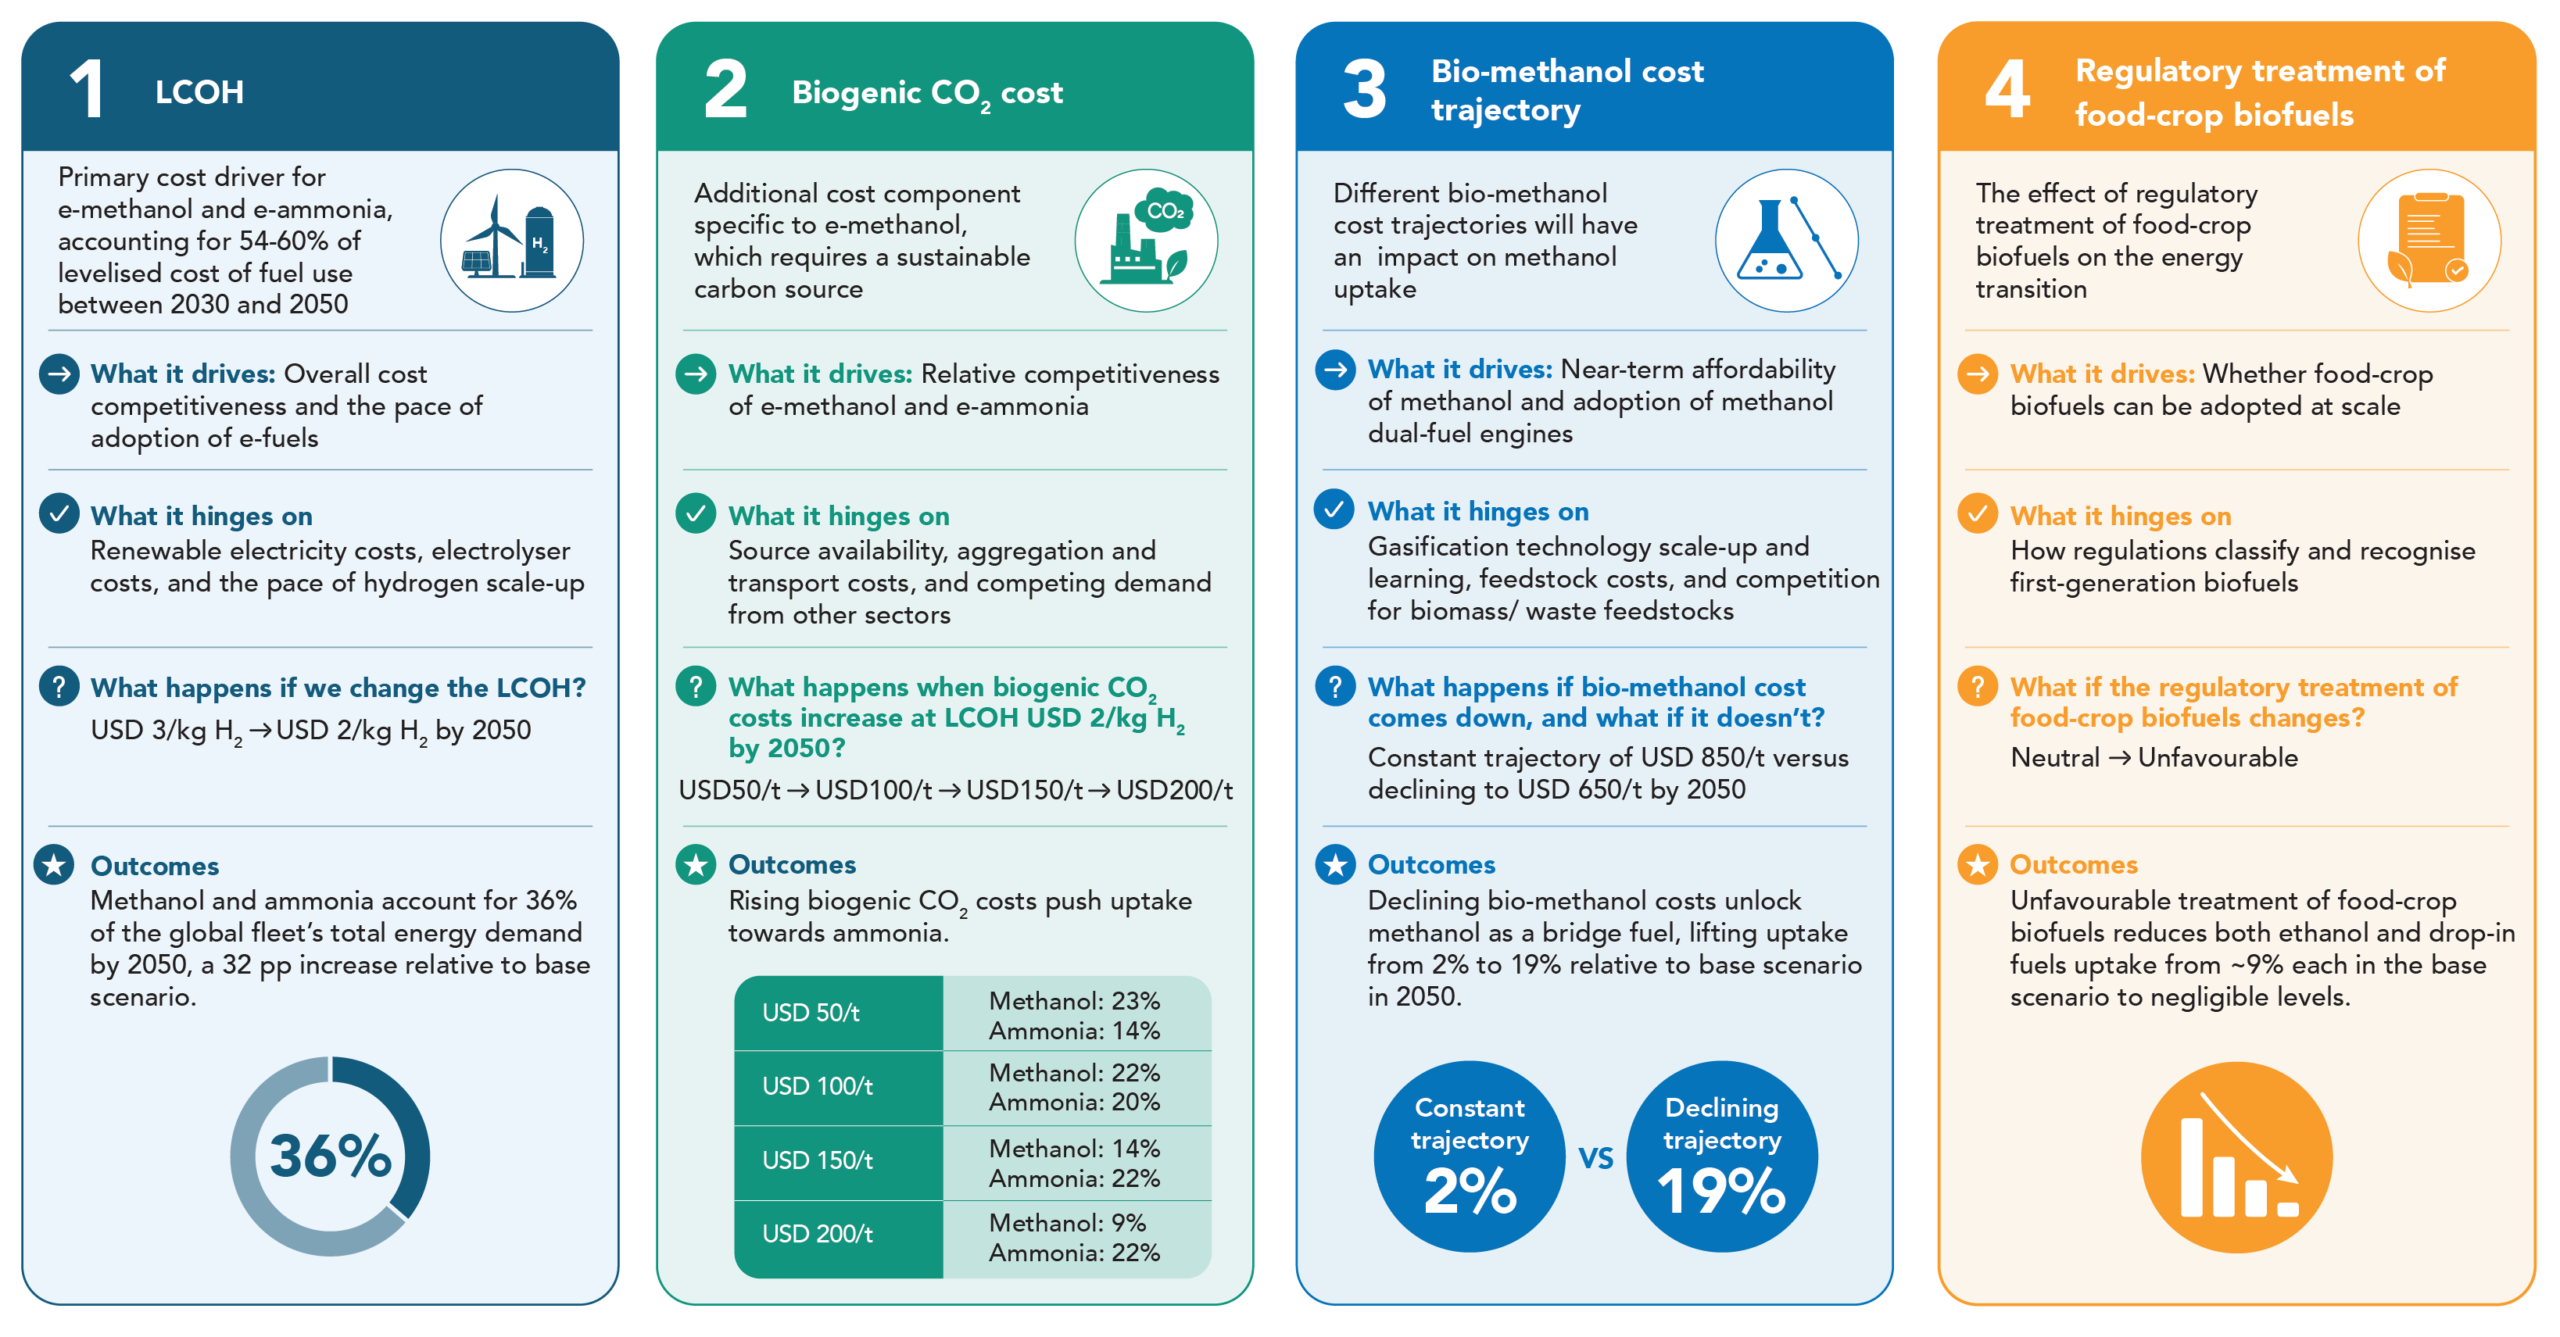
LCOH is the primary cost driver for both e-methanol and e-ammonia, accounting for around 54-60% of total levelised costs.
In the base scenario, LCOH is assumed to be around USD 3/kg H₂ by 2050. If it declines further to around USD 2/kg H₂, supported by faster renewable-energy deployment and lower electrolyser costs, the economics of e-fuels improve substantially.
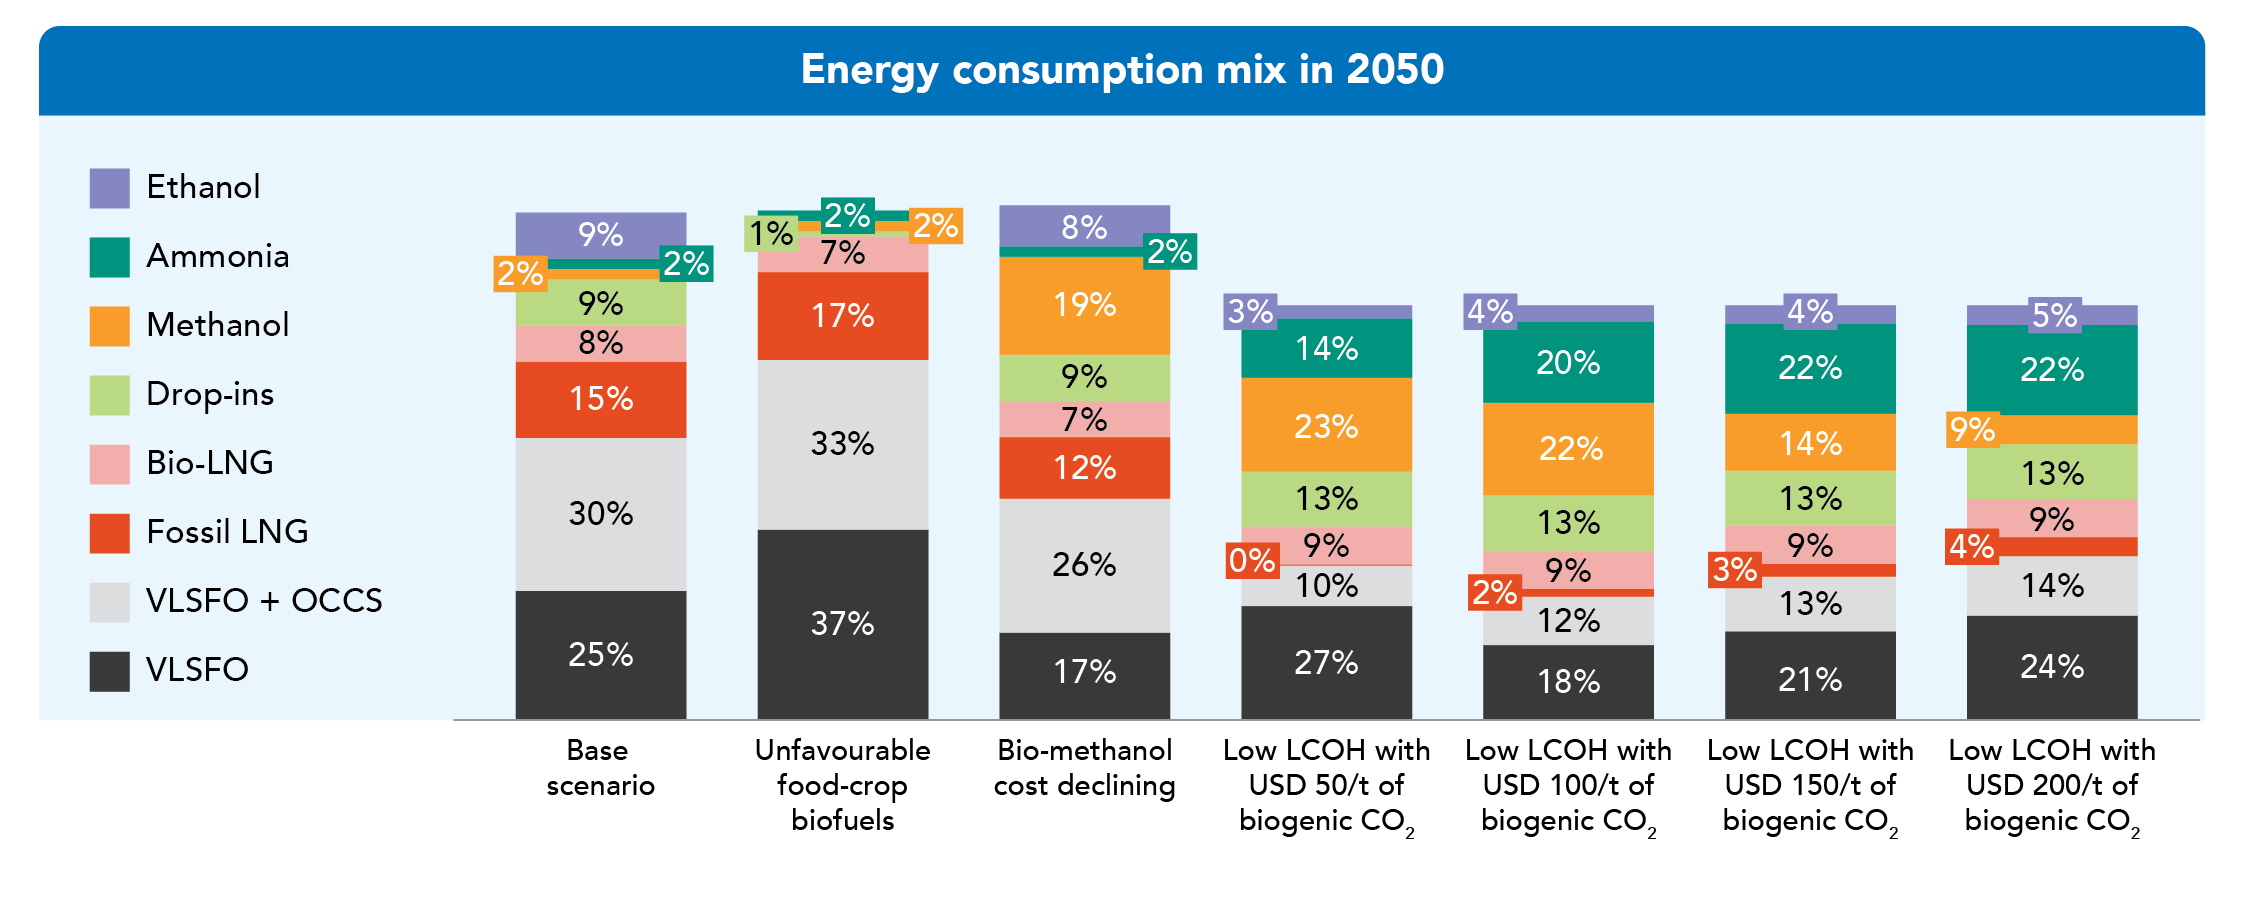
Methanol and ammonia together could account for 36% of the global fleet’s total energy demand by 2050, a 32 percentage points (pp) increase relative to the base scenario, which assumes an LCOH of USD 3/kg H2.
Biogenic CO₂ cost plays a key role in determining the split between e-methanol and e-ammonia.
Unlike e-ammonia, e-methanol requires a sustainable carbon source in addition to renewable hydrogen. The model assumes this comes from biogenic CO₂, introducing an additional production cost that e-ammonia does not face. At the base assumption of USD 150/tCO₂, biogenic CO₂ accounts for around 16-20% of e-methanol’s total levelised cost.
As biogenic CO₂ costs rise, e-methanol becomes less competitive relative to e-ammonia. At an LCOH of USD 3/kg H₂, e-methanol has a lower total levelised cost than e-ammonia when biogenic CO₂ costs are below USD 150/tCO₂. Above this level, the relative cost advantage shifts towards e-ammonia.
This shift in relativeness competitiveness translates directly into fuel uptake. At USD 50/tCO₂, methanol accounts for 23% of global fleet energy consumption in 2050, ahead of ammonia at 14%. At USD 150/tCO₂, the balance reverses, with ammonia reaching 22% versus 14% for methanol. At USD 200/tCO₂, methanol falls further to 9%.
Bio-methanol is unique among the fuel pathways because its uptake has an outsized effect on the longer-term adoption of methanol.
It provides a lower-carbon fuel in the near term while driving investment in methanol dual-fuel engines that can later transition to lower-carbon e-methanol without requiring a change in onboard hardware.
The trajectory of bio-methanol production costs therefore influences both near-term engine investment and longer-term methanol uptake.
Under a declining bio-methanol cost trajectory, methanol consumption increases from 2% to 19% of total fleet energy demand in 2050. This cost reduction nearly doubles the share of methanol dual-fuel engines in the fleet before 2035, stimulating orderbook commitment ahead of e-methanol becoming cost-competitive.
By contrast, if bio-methanol costs remain constant, methanol accounts for only 2% of total fleet energy demand in 2050.
Ethanol adoption is highly sensitive to how food-crop-based biofuels are treated under regulation.
In the base scenario, where first-generation bio-ethanol receives neutral treatment under the IMO NZF, ethanol accounts for approximately 9% of global fleet energy consumption in 2050.
However, when food-crop-based biofuels receive unfavourable regulatory treatment, as under FuelEU Maritime, cost-competitive first-generation bio-ethanol is effectively removed from the fuel mix, leaving only more expensive second-generation alternatives.
Under the EU regulations scenario, ethanol accounts for just 3% of total fuel demand in 2050, supplied entirely by second-generation bio-ethanol.
How do fuel economics influence engine ordering decisions and the long-term evolution of the fleet?
Near-term fuel affordability influences the engine types shipowners order today but fuel economics determine what vessels actually consume in future.
With vessel lifetimes of 25-30 years, annual fleet renewal of only around 4%, and the lead time between ordering and delivery, more than half of the vessels operating in 2050 are expected to originate from orders placed before 2035.
Yet having the capacity to consume a new fuel does not guarantee its uptake. Dual-fuel engines allow shipowners to switch between conventional fuel and the selected new fuel as economics and regulations evolve.
This makes near-term fuel affordability as consequential as a fuel’s projected cost in 2050. Fuels that remain expensive through the 2030s risk missing the critical orderbook window, even if their long-term economics later improve.
New fuels must secure sufficient engine capacity and remain cost-competitive to scale successfully.
First, there must be sufficient engine capacity through newbuild orders.
Second, the fuel must remain cost-competitive, year after year, once the vessels are in service.
The model shows why both are necessary.
In the base scenario, around 10% of the fleet has methanol dual-fuel engine capacity by 2050, yet methanol accounts for only 2% of actual energy consumption. This is because conventional fuel remains the more economical option in 2050, even with a USD 380/tCO2e penalty.
Notes:
Total addressable energy demand is lower under the faster global decarbonisation considered for low LCOH (7.1 EJ) than under the base decarbonisation speed (8.6 EJ), primarily reflecting a faster structural decline in seaborne fossil fuel trade—particularly coal and crude oil cargo volumes—as the global energy transition accelerates. All fuel shares are presented as a percentage of each scenario’s respective total fleet energy demand.
Source: GCMD and BCG analysis
How might these developments reshape the future global bunkering landscape?
Liquid fuels, such as methanol and ethanol, are relatively straightforward to transport and bunker, and are therefore likely to reinforce established bunkering hubs.
Ammonia uptake, by contrast, could reshape the landscape significantly. Its handling requirements and higher transport costs could give rise to two hub archetypes: production-linked hubs that compete on access to low-cost fuel, and import-aggregation hubs that compete on scale by combining maritime demand with demand from adjacent industrial and power sectors.
Ammonia bunkering is expected to be more dependent on either proximity to low-cost production or the ability to aggregate large-scale demand, pointing to two distinct port archetypes:
- Production-linked hubs: Ports with access to low-cost fuel production and export infrastructure, giving them a potential bunkering cost advantage. Their success depends on being located along relevant trade routes and converting this cost advantage into bunkering demand.
- Import-aggregation hubs: Ports with high vessel traffic and strong infrastructure but without low-cost domestic production. Their advantage comes from aggregating maritime and adjacent-sector demand to procure fuel at scale, support import infrastructure and lower delivered bunkering costs.
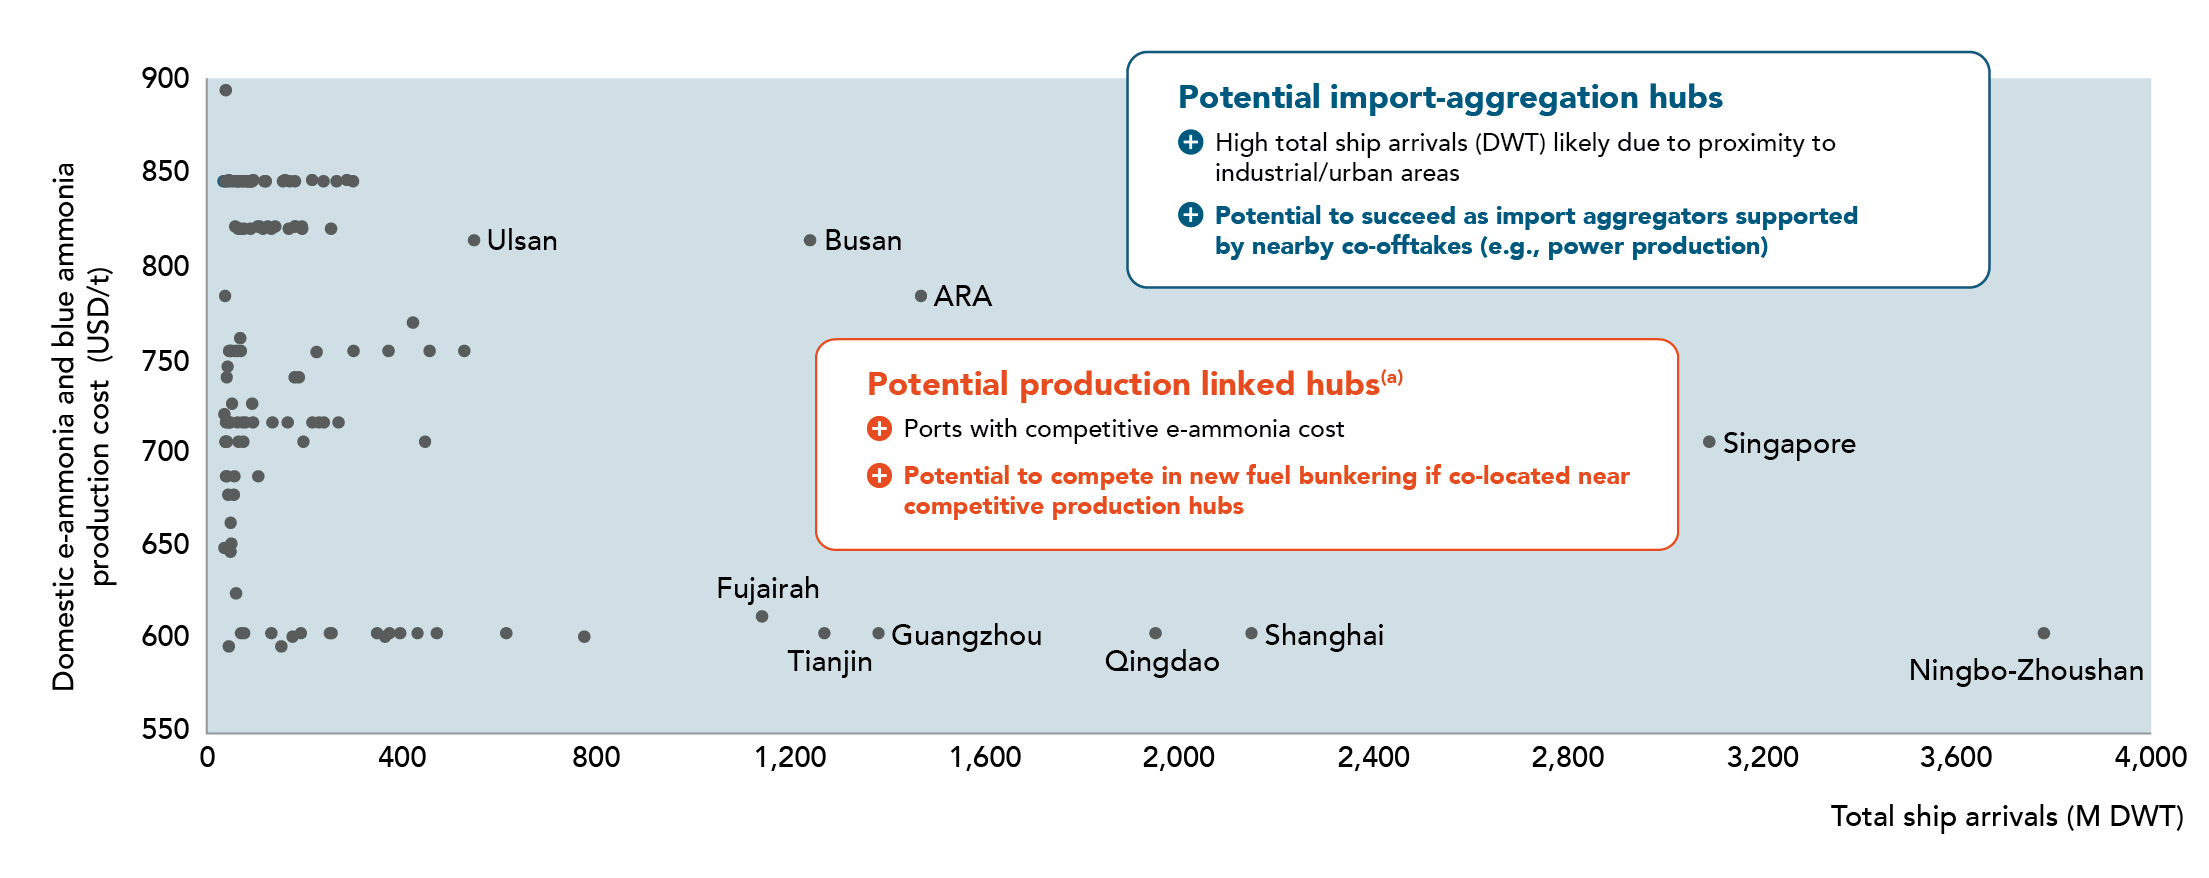
Notes:
(a) For production hubs, the lowest cost of production is used for plants with a commercial operation date by 2035, and a 15% decline in costs due to scale/ learning effects by 2050 is assumed
Domestic e-ammonia and blue ammonia production cost (min, USD/t, 2050): The lower between e-ammonia and blue ammonia production cost in 2050 applied for ports based on countries where costs are available; For ports where country-specific data is unavailable, the closest proxy is used
Total ship arrivals (M DWT, 2023): Latest data available from 2023; For Busan, Ulsan, and Chinese ports, ship arrivals (DWT) was unavailable and estimated by taking the ratio between the specified port and other key port’s total cargo throughput x ship arrivals (DWT).
Unlabelled dots indicate additional ports covered by the analysis, shown to illustrate its scope; the chart is not a comprehensive listing of all ports assessed.
Source: GlobalData, BCG H2 model, Expert interviews, Institute of Shipping Economics and Logistics, GCMD and BCG analysis
What should maritime stakeholders do now?
Shipowners and operators should build fleet strategies around optionality rather than early commitment to a single fuel pathway.
No scenario in this analysis produces a single dominant fuel by 2050, and vessels locked into one pathway risk being disadvantaged as regulation and fuel economics evolve.
Dual-fuel capability can help manage this uncertainty by preserving the ability to switch between compatible new and conventional fuels. At a Tier-2 RU penalty of USD 380/tCO₂e, vessels consuming VLSFO equipped with OCCS remain cost-competitive. If penalties rise towards USD 700/tCO₂e, however, dual-fuel vessels are better positioned to pivot towards new fuels as the economics shift.
Different fuels are likely to develop different geographical supply advantages.
Bio-methanol is expected to be most cost-competitive along global sea lanes, with Southeast Asia and Europe emerging as competitive export hubs.
Ammonia bunkering is likely to favour Asia sea lanes, supported by lower-cost production in China and India.
The United States is expected to retain a cost advantage in bio-ethanol.
A vessel operating on trans-Pacific routes may therefore face a materially different future bunkering landscape from one operating on Atlantic corridors, and that differentiation should inform engine configuration decisions now, while the orderbook window is still open.
Ports should assess their competitive advantages across both new fuel demand and supply.
Production-linked ports may benefit from access to low-cost fuel and export infrastructure, while import-dependent ports can build competitiveness by aggregating maritime demand with demand from adjacent industrial and power sectors. Cross-sector synergies could also help de-risk infrastructure investments.
Investors should test investment cases against multiple regulatory and fuel-cost outcomes, rather than underwriting projects on a single assumption.
Investment cases for new fuel infrastructure are highly sensitive to the regulatory outcome and penalty level trajectory. Given that the final penalty outcome remains unresolved, investment cases should be explicitly structured across both scenarios rather than underwritten on a single regulatory assumption.
Within the new fuels space, investors should also monitor the variables that directly influence which fuel infrastructure warrants priority investment: the maturation of the bio-methanol production pathway and, the LCOH trajectory and biogenic CO2 costs.
Global policies such as the IMO NZF could significantly accelerate the maritime energy transition provided that the carbon price is sufficiently high to close the cost gap between new and conventional fuels. While regional policies can create early markets and provide demand signals, they are unlikely to substitute for a functioning global carbon-pricing mechanism.
Given the importance of cost gaps and the rate at which they close, fiscal policies could be beneficial. For example, potential ZNZ reward mechanisms would incentivise new fuel adoption in the early years. Governments could also consider introducing policies to stimulate innovation and the scaling of new fuel production technologies, reducing production costs and increasing their supply competitiveness.
Get in Touch

